You should be thinking about how you’re going to infuse AI throughout your organization from day one. That’s one reason to start with a large number of small projects, rather than a single big one: many small successes will mean much more to stakeholders than one big success, and certainly much more than one big failure. We’re telling you right now, some of your new projects will fail—that’s true in any area, but particularly so when you’re taking on a new technology. If you’re going to take advantage of AI, you need to use it everywhere; you need to push it into every department, every business process, every activity, and make your workflows intelligent.
C-suite executives are turning to AI because in order to compete, they need to be able to innovate at speed. Their goals include:
Predicting and shaping future outcomes
Humanizing customer experiences
Empowering people to focus on higher-value work
Supporting human capital in their efforts to reimagine new business models by infusing intelligence into their workflows
For many organizations, the best strategy to achieve these goals is to start at the top of the AI Ladder. That sounds counterintuitive, but remember we noted earlier that the ladder isn’t perfectly linear; it’s possible to start at the top (or on any rung, really), pushing AI through the organization, and then go back to work on collecting, organizing, and analyzing your data. Here’s the trick: you don’t have to start with nothing. You can start with prebuilt AI applications that can easily be adapted to your business situation.
For an AI transformation to succeed, you have to infuse intelligence across all of your workflows. And prebuilt applications are less likely to be trapped in the limbo between the lab and production.
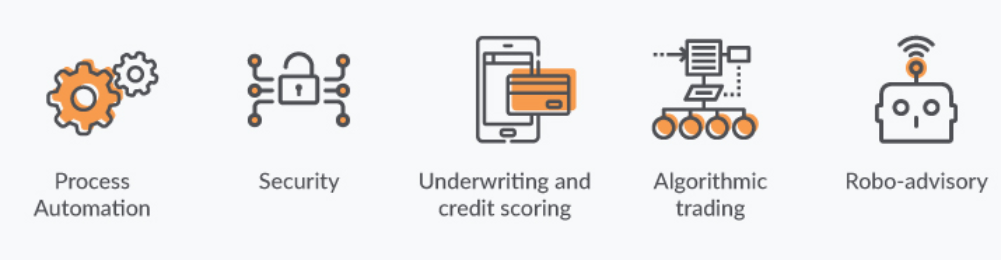
The work we’ve done with clients has identified five key business domains to which C-level executives are applying AI to transform their workflows. They are:
Data science and analytics tools are evolving and can be broadly classified into two classes: tools for those techies with high levels of expertise in programming and profound knowledge of statistics and computer science like R, SAS, SPSS, etc.; and tools for common audiences that can automate the general analysis and daily reports like Rapid Miner, DataRPM, Weka, etc. displayed in the currently prevalent languages, tools, and software that are used for various data analytics applications.
In a very broad sense, financial services [1; https://en.m.wikipedia.org/wiki/Financial_services ], as defined by Wikipedia, is comprised of businesses that manage money. These include credit unions, banks, credit card companies, insurance companies, accountancy companies, consumer finance companies, stock brokerages, investment funds, and individual fund managers. Of course, in our discussion, I am not going to talk about the government-related financial services.
As far as the segmentation of the financial services market is concerned, I will be using the following broad segments that are described in Table 13-1.The clear differentiation in the business approach can be seen from Table 13-1.Table 13-1
Different Segments of Financial Industry, Broad Classification
Type
Focus
Services and Differentiation
Consumer Finance
Providing personal loans, indirect financing, including lease and sales financing, credit card issuers, pawn shops, and payday loan providers
Provide unsecured loans to individuals for both commercial and personal purposes. They operate in the subprime category and provide loans to individuals with bad credit history
Capital Markets
Undertake activities, including trading, brokerage, strategic advisory, portfolio management, asset management, and investment advice
Primarily work as intermediaries, either to provide or manage capital, thereby satisfying financial goals of institutions and individuals
Diversified Financial Services
Providing financial services, such as financial advisory firms, investment research companies, stock exchanges, and credit rating companies
A majority of their revenue is derived from one particular area of expertise and specialized activity
In Table 13-1 the market segmentation of the financial services industry [2; http://media.lockelord.com/files/upload/advisenIndustryReportDivFinConsFinCapMrkt.pdf], which is based upon the financial services industry, subprime and credit crisis weighs heavy, according to a 2008 edition report by John W. Molka III, CFA Senior Industry Analyst and Editor. We first look at the consumer finance section, which is a group of companies providing personal loans, indirect credit card issuers, pawn shops, and payday loan providers. This list does not include mortgage and lending companies. The main item that these companies deal with is unsecured loans to individuals. Of course, all the statistics given in the report are based on the US; however, the percentages are applicable for all the developed countries. For example, the consumer finance companies hold 23 percent of the consumer credit as of 2007, and this can be applied to other developed economies as well. While this statistic looks dated by more than 10 years, it gives us an idea of how much share the consumer finance companies hold in the consumer credit in a nation’s economy.
Next in the segment are capital markets, which are comprised of organizations undertaking stock trading brokerages, strategic financial advisory portfolio management, asset management, and professional investment advice. These companies are intermediaries, and they work for the goals of other financial institutions or individuals. These companies include investment banking and trading in stocks, bonds, derivatives, and commodities. It also includes asset management firms that manage large funds for individuals and institutions around the world. The increasing trend in the sector is the rise in investment banking and securities dealings and that of securities brokerages. The largest services category is investment banking and security dealing, which comprises 41 percent of the total segment business. An increasing trend in the segment is the rise of mutual funds and investments, and this trend can be seen both in the developed and emerging markets.
Which is essentially the companies involved in financial advisory investment research, stock exchanges, rating, and credit rating. This is a market where there are top 10 players, like Citigroup, Berkshire Hathaway, Goldman Sachs, Morgan Stanley, JP Morgan Chase, and Merrill Lynch. The next is the diversified financial services segment.
Now that we have looked at the broad segmentation in the financial industry [2], we will now look at some of the key segments and the value proposition that they provide.
Financial Segments
In the drill-down financial statements diagram in Figure 13-1, we can see the categorization of financial industry into banking and nonbanking segments.
Figure 13-1 Financial segments
The banking segment is comprised of consumer lending, which is a very structured form of business where the creditworthiness of the consumer is ascertained through the creation of credit profiles of the consumer. If the credit profile is found to be risky, then the rescue level is ascertained, and only then is the lending possible in the segment. Next is the business lending, which is also a very structured form of lending to commercial organizations for their investment and growth. Although this type of business lending also has a lot of variations, I am not going to go into them now. The third type of banking segmentation is that of e-payments. Both the consumer and the business make electronic payments through the electronic payment banking systems, which are local to each country. The consumer lending can further be divided into credit card lending and secured loans lending. Credit cards are issued by banks only when the creditworthiness of a person is ascertained so that they can perpetually use the credit and then repaired within the given stipulated period. Secured loans are given only when the creditworthiness of an individual is ascertained with respect to the assets that they hold and the liabilities that they have against various loans that they might have taken in the past.
In the non-banking space, we divide the segment into advisory services and the stock markets. In advisory services we again divide our segment into credit advisory services and investment advisory services. The credit advisory services are related to the credit ratings of agencies, banks, countries, and companies. There are various credit rating agencies that operate all over the world and they fall in this segment category. Investment advisory is concerned with management and advice on the funds held by various individuals and organizations. This includes portfolio management services and other such financial advice given by various agencies. Stock markets involve a segment of portfolio management services and brokerages that can be the regulated stock exchanges and unregulated stock exchanges, like the ones used by blockchain technology (e.g., bitcoin). We will be referencing this drill-down version of our segmentation of the finance industry in this finance section throughout this book.
Finance Value Proposition
Value proposition, as defined by Google dictionary, is marketing and innovation, service, and features intended to make a company or product attractive to customers.
Figure 13-2Finance customer value proposition
The finance-based services that are offered by organizations have a different values proposition for consumers and businesses for both banking and financial services. This is depicted in Figure 13-2.
In a typical financial organizational setup, there are some common departments like consumer services and business and investment services. Especially in the consumer services division, it is further divided into general consumers and premium customers or privileged customers. The financial institution like a bank or a financial advisory or portfolio management company differentiates between the consumers in this way and offers its different level of services accordingly. We will now look at how machine learning is being applied in some of these departments. An important thing to note is that the customer generally faces only the marketing department or the customer support department, and the rest of the department works in the back end. However, in the financial services industry, there is an increasing trend to have a dedicated relationship manager for privileged or premium services customers.
In Figure 13-1 we already saw the type of services under non-banking segment, mainly comprised of advisory services (both credit and investment) and the services related to the capital of the stock markets. It is important to understand here that both credit and investment advisory services can be for personal individuals as well as for other companies, organizations, or institutions. The consumer-based are the advisory services provided to individuals as customized or tailored for the needs of that individual. These types of credit advisory services are premium services meant for the privileged people of the society. The focus is to provide credit information such as rating, bankruptcy status, financial analysis, fraud alert, and other services in this category. The investment advisory services are provided in the form of portfolio management, asset management services, and fund management services for individuals. It is upon the individual to buy both advisory and management services from that particular provider or to buy advisory services from one provider and the investment management service from another provider. Usually, consumers or individuals who have high net-worth generally prefer to get investment advisory and management services from the same financial service provider.
There is another segment or category of financial services that have value proposition falling under the category of e-payment. These are services provided online through the internet on various websites and also in the form of app-based services through mobile phones such as Android or iPhone. The offerings in this category of e-payment or online payment financial service providers [3; https://en.wikipedia.org/wiki/List_of_online_payment_service_providers ] is more oriented toward country-based providers, and there are very few providers who can actually call themselves global. Prominent in this category are providers like Paypal, Payoneer, Apple Pay, Amazon Pay, and Google Pay, who are from the US but have a major global presence. PayU is another that has a good global presence; however, we have some regional ones, such as Trust in the European Union and Alipay in China. This list is not exhaustive; however, there are many more that have deep regional and local presence.
The reason for such a thin growth in the global players of this segment is the fact that financial services are a highly regulated industry. The major central banks around the world regulate and bring out norms, guidelines, and proposed laws for regulating these types of services. Any major operator who wants to become a global operator has to have not just the understanding but the capability to implement regulations in major countries around the world where it wants to operate. The global players that I have listed have been able to meet these norms, and hence they have been able to build a global base.
There are some service providers that have only an online presence; however, there are some that have an app-based mobile presence as well, such as Alipay from China, which has both mobile and online payment platforms. Payoneer provides e-wallet services or digital payments services, which allow customers to send and receive funds into their bank accounts or reload them into prepaid debit cards. This company focuses more on business-to-business payments across the world. It is now known as the backbone of the business-to-business digital transaction system globally. Similar to Payoneer is PayPal, which allows online money transfers as a replacement to checks and money orders. Paypal, however, does not focus just on business-to-business but also on business-to-consumer transactions as well.
Before I wrap up the value proposition section, I would like to mention the recent developments that have happened in the e-payments category, which have been the advent of blockchain technology that have brought virtual currency like bitcoin and ethereum. These currencies have not been accepted by major countries and their central banks as a mode of payment and have been banned in some countries like South Korea and India. I don’t want to go into the controversy of these e-payment services; however, you should be aware that there are a lot of startups around the world that have cropped up and are providing digital payment services in these blockchain currencies as well. Prominent among them is Payza, which allows bitcoin money orders and transfers to credit or debit cards via bitcoin or altcoin. In my opinion, this perception that a lot of illegal transactions happen through the blockchain type of currencies will get moderated in the near future and will come under the regulations in major countries around the world. Blockchain technology that is peer-to-peer or consumer-to–consumer is more trusted by the users since there is no centralized server or centralized institution that is controlling the entire system. The decentralized financial framework, in my opinion, is the future that is waiting to happen once the technological understanding deepens with the regulators around the world and people adopt the technology in spite of the regulations and the warnings given by various governments.
The Process of Technology Adoption in the Finance Sector
Figure 13-3 depicts the process of technology adoption taken from this book’s healthcare section.
Figure 13-3 Process of technology adoption
Descriptive Analytics: This field of analytics is invoked to know the answers to questions for projects that have already happened in the past, such as what is the status of X financial transaction in the past?
Traditionally the finance sector has been using descriptive analytics to produce reports about its customers for any given services category, and this has had a big impact with the top management while making various decisions, such as whom to target for any new financial product, how do we make strategy change decisions against competitors, and how is our service perceived by the end customers? All these questions are very well-answered by descriptive analytics. This is beside the trend of putting together the five-number summary for any data to the management [4; https://en.wikipedia.org/wiki/Five-number_summary ]. For example, for comparison of financial data sets between the spending patterns of the millennials and the baby boomers generations, five-number summary may tell us about how the minimum spending pattern and maximum spending pattern differ between these generations. It then becomes easy for the top management to customize their financial services offerings to them specifically. Unless descriptive analytics is used, it will not be possible to take out such information.Product-wise sales reports, product-wise discount reports, and store-wise and product-wise sales reports are some of the examples where descriptive analytics has been used traditionally. This trend is not going to go away. We will see the use of descriptive analytics in the retail sector. However, we will also see the emergence of other analytics that I talk about in the next section. I give you an example of how to use the five-point summary of financial data in the short example Python code in Listing 13-1. Since this is an example, I will be taking not more than 10 rows of data; however, in the real world this would be comprised of data for millions of users. All values for spending are in US $ and yearly value.import numpy as npbboomers = np.array([14230, 345, 1912, 472, 63, 861, 270, 713])fivepoints= [np.min(bboomers), np.percentile(bboomers, 25, interpolation=”midpoint”), np.median(bboomers),np.percentile(bboomers, 75, interpolation=”midpoint”),np.max(bboomers)]for fivepointsummary in fivepoints:print(fivepointsummary)Output:63307.5592.51386.514230import numpy as npmillennials = np.array([12519, 845, 912, 72, 93, 615, 70, 538])fivepoints= [np.min(millennials ), np.percentile(millennials , 25, interpolation=”midpoint”), np.median(millennials ),np.percentile(millennials , 75, interpolation=”midpoint”),np.max(millennials)]for fivepointsummary in fivepoints: print(fivepointsummary)Output:7082.5576.5878.512519Listing 13-1
Python Code for Five-Points SummaryAfter running the Python code in Listing 13-1, we see the output that the minimum average yearly spending by baby boomers in our data set is 63, that the 25th percentile happens at 307.5, the median lies at 592.5, the 75th percentile is at 1386.5, and the maximum that a baby Boomer generation spends in our data set is $14,230 yearly. In the second code snippet for Listing 13-1 , we see the minimum that millennials spend is $70, and the 25 percentile stands at 82.5, the median is at 576.5, the 75th percentile is at 878, and the maximum spend is at $12,519 yearly. In a simple comparison like this, an excellent guide to determine who is spending more for example, in our data set the baby boomers generation is spending the highest; however, they are also spending the lowest, so the dispersion is higher in the case of baby boomers than the millennials. Baby boomers spending appears in both max and min function in Listing 13-1. You will find this kind of a scenario in practical datasets. The Key thing is to know how to interpret and analyze it. The median values speak a lot about how the spending of the baby boomers and millennials in our data set is structured, and the median value for the baby boomers is pretty low, at 82.5, in comparison to the baby boomers, which is at 307.5. This means that the baby boomers are indeed higher spenders, with the midpoint line much higher in our data set.
Diagnostic Analytics: We know that this type of analytics is used to know the root cause of a phenomenon, such as a project success or a failure. Why did the X fraud happen? What was the root cause of this fraud to happen in our financial systems? What was the root cause that our financial systems did not catch the money laundering transactions? All such questions can be answered using diagnostic analytics. All forms of financial risk assessment come under diagnostic analytics. A practical implementation is a tool by Pricewaterhouse Cooper known as Halo [5; http://halo.pwc.com/ ]. This tool works on accounting journals and ledgers and has the capability to flag higher-risk transactions. Of course, this is not an online real-time solution since the effort is only to diagnose and point out the financial risks. Accounting is about old transaction records, and that is what a tool like a halo tries to extract information from a client’s systems and discover to bring forth high-risk transactions with their patterns and trends. It also gives out information on process inefficiencies in the accounting process, like eliminating duplicate accounting journal entries, etc. This is especially useful for a large financial organization because of the high volume of transactions that happen during a particular period in various departments.
Predictive Analytics: We have seen in the healthcare and retail sections of this book that this type of analytics is used for determining the outcome of an event in the future, such as a financial transactions success or failure, financial budget overrun, or a budget slippage for an organization such as a bank or a company. This analytics is something that brings about the actual ability to avoid situations in the future—for example, by using predictive analytics we can predict if a particular type of financial transaction is going to succeed or fail. There could be various parameters that the machine learning model code takes into account for analysis before coming to such a conclusion. However, the whole purpose is to give a sense to the top management on the direction that the financial side of the business is going to take. Even this does not solve the problem, but it merely tells or acts as a warning signal of a failure or a deviation from the plan in the future related to finances. When we apply predictive analytics, then we get a lot more fields of finance that come into play, such as cost accountancy, managerial economics, and decision support systems. Giving out predictive costing reports based on past cost accountancy data is something that I have implemented for one of my clients. This helps large financial businesses stay on track with their cost budgets and ensure the right flags are raised in case the actual cost is predicted to increase as a result of prediction by a machine learning model. In management accounting or economics, as it is known in the academic circles, the focus is on what-if scenarios, such as $x million invested in pqr and abc projects and which one is better. And why? What if we invested the $x million in acquiring a certain startup? What would be the ROI on that investment in comparison to putting in the above two projects? All such complex decision-making questions are very easily answered by building machine learning models based on past data and applying them based on principles of management accounting.
Prescriptive Analytics: We now know that in this field of analytics the maximum value of analytics is achieved as it builds upon the prediction made based on predictive analytics, and it prescribes actions that should be taken for the future. In prescriptive analytics, it uses machine learning to build a future plan of action that is based on past failures in financial transactions in similar situations, such as failed financial transactions, and it gives out specific activities that need to be carried out in order for the financial transaction to be a success. In the financial sector, prescriptive analytics is now truly able to do course corrections even before the failures happen. Every financial organization around the world is striving to make a breakthrough in this field of analytics; however, there are very few successes as of the time of writing this book. I say this because if you take the case of business cycles, although it is known from the domain of macro-economics that they occur roughly 8 to 10 years, nobody is still able to predict when they would really happen again. The prescriptive part starts when there is an accurate prediction made; then the actions that need to be taken even before this happens come after that. For example, a global financial conglomerate bank creates a machine learning model to predict the onset of the next global financial recession with an accuracy of 92 percent; however, this is not enough. The top management needs to know what steps they need to take so that the impact on the organization is nearly minimal. Building and creating such a system would need a huge amount of data and many years of a model building-testing-feedback cycle in order to arrive at production. There are organizations that are trying to build models to predict the crash and boom cycles in capital markets; however, due to the involvement of such a high amount of data and environment variables, there is no breakthrough yet.
One of the most common statistical methods is linear regression. At its most basic, it’s used when you want to express the mathematical relationship between two variables or attributes. When you use it, you are making the assumption that there is a linear relationship between an outcome variable (sometimes also called the response variable, dependent variable, or label) and a predictor (sometimes also called an independent variable, explanatory variable, or feature); or between one variable and several other variables, in which case you’re modeling the relationship as having a linear structure. Changes in one variable correlate linearly with changes in another variable. For example, it makes sense that the more products you sell, the more money you make.
Lambda Architecture is not technology dependent; rather it is agnostic of technology and defines some practical and well-versed principles to handle and cater to big data. It is a very generic pattern that tries to cater to common requirements raised by most big data applications. The pattern allows us to deal with both historical data and real-time data alongside each other. We used to have two different applications catering to transactional –– OnLine Transaction Processing (OLTP) and analytical –– OnLine Analytical Processing (OLAP) data, but we couldn’t mix these together; rather they live separately and don’t talk to each other.
These bullet points describe what a Lambda Architecture is:
Set of patterns and guidelines. This defines a set of patterns and guidelines for the big data kind of applications. More importantly, it allows the queries to consider both historical and newly generated data alike and gives the desired view for the analysts.
Deals with both historical (batch) and real-time data.
Technology agnostic and generic in nature. Not at all dependent on technologies, this is a pattern that is generic, and any technology can be used so long as the main layer and its responsibilities are met.
It clearly separates responsibilities into distinct layers. It does separate responsibilities between layers and complies with the Separation of concerns principle of architecture beautifully.
It’s domain agnostic. It can be applied to different types of business domains as it is a pattern that is generic.
Many a times, Data Lakes are also perceived as Data Warehouses. Both Data Lake and Data Warehouse have different objectives to be achieved in an enterprise. Some of the key difference are shown here:
Data Lake
Data Warehouse
Captures all types of data and structures, semi-structured and unstructured in their most natural form from source systems
Captures structured information and processes it as it is acquired into a fixed model defined for data warehouse purposes
Possesses enough processing power to process and analyze all kinds of data and have it analyzed for access
Processes structured data into a dimensional or reporting model for advanced reporting and analytics
A Data Lake usually contains more relevant information that has good probability of access and can provide operational needs for an enterprise
A Data Warehouse usually stores and retains data for long term, so that the data can be accessed on demand
This is one of the most popular use cases within banks that is migrating trade data from traditional relational data sources to Hadoop. This is also known as online data archiving.
Transaction data Archival
When we acquire a new data warehouse in any financial organization, the fundamental design is based on this question, “What do we need to store and for how long?” Ask this question to businesses and their answer will be simple—Everything and forever. Even regulatory requirements, such as Sarbanes-Oxley stipulate that we need to store records for at least 5 to 7 years and the data needs to be accessible in a reasonable amount of time. Today, that reasonable amount of time is not weeks, as before, but in the order of days or even one business day for certain types of data. In banks, data warehouses are mostly built on high-performance enterprise databases with very expensive storage. So, they retain only recent data (say the last year) at the detailed level and summarize the remaining 5 to 10 years of transactions, positions, and events. They move older data to tapes or optical media to save cost. However, the big problem is the detailed data is not accessible unless it is restored back to the database, which again costs time and money.
The problem of storage is even worse, because generally the trade, event, and position tables have hundreds of columns on data warehouses. In fact, business is mostly interested in 10–15 columns of these tables on a day-to-day basis and all other columns are rarely queried. But business still wants the flexibility to query less frequently used columns, if they need to.
Solution
Hadoop HDFS is a low-cost storage and has almost unlimited scalability and thus is an excellent solution for this use case. One can archive historical data from expensive high-performance databases to low-cost HDFS, and still process the data. Because Hadoop can scale horizontally, simply by adding more data nodes, the business can store as much as they like. Data is archived on Hadoop HDFS instead of tapes or optical media, which makes the data accessible quickly. This also offers flexibility to store less frequently used columns on HDFS.
Once data is on HDFS, it can be accessed using Hive or Pig queries. Developers can also write MapReduce jobs for slightly more complicated data access operations.
Low-cost data warehouse online archives is one of the simplest Hadoop projects for banks to implement and has an almost immediate return on investment. Following are the different ways, how we make use of Hadoop
Option 1: While loading transactions from source systems into a relational data warehouse, load frequently used columns into the data warehouse and all columns into HDFS
Option 2: Migrate all transactions that are older than a year from the relational data warehouse to HDFS
Financial organizations have been actively using big data platforms for the last few years and their key objectives are:
Complying with regulatory requirements
Better risk analytics
Understanding customer behavior and improving services
Understanding transaction patterns and monetizing using cross-selling of products
Data archival on HDFS
Archiving data on HDFS is one of the basic use cases for Hadoop in financial organizations and is a quick win. It is likely to provide a very high return on investment. The data is archived on Hadoop and is still available to query (although not in real time), which is far more efficient than archiving on tape and far less expensive than keeping it on databases. Some of the use cases are:
Migrate expensive and inefficient legacy mainframe data and load jobs to the Hadoop platform
Migrate expensive older transaction data from high-end expensive databases to Hadoop HDFS
Migrate unstructured legal, compliance, and onboarding documents to Hadoop HDFS
Regulatory
Financial organizations must comply with regulatory requirements. In order to meet these requirements, the use of traditional data processing platforms is becoming increasingly expensive and unsustainable.
A couple of such use cases are:
Checking customer names against a sanctions blacklist is very complicated due to the same or similar names. It is even more complicated when financial organizations have different names or aliases across different systems. With Hadoop, we can apply complex fuzzy matching on name and contact information across massive data sets at a much lower cost.
The BCBS239 regulation states that financial organizations must be able to aggregate risk exposures across the whole group quickly and accurately. With Hadoop, financial organizations can consolidate and aggregate data on a single platform in the most efficient and cost-effective way.
Fraud detection
Fraud is estimated to cost the financial industry billions of US dollars per year. Financial organizations have invested in Hadoop platforms to identify fraudulent transactions by picking up unusual behavior patterns.
Complex algorithms that need to be run on large volumes of transaction data to identify outliers are now possible on the Hadoop platform at a much lower expense.
Tick data
Stock market tick data is real-time data and generated on a massive scale. Live data streams can be processed using real-time streaming technology on the Hadoop infrastructure for quick trading decisions, and older tick data can be used for trending and forecasting using batch Hadoop tools.
Risk management
Financial organizations must be able to measure risk exposures for each customer and effectively aggregate it across entire business divisions. They should be able to score the credit risk for each customer using internal rules. They need to build risk models with intensive calculation on the underlying massive data.
All these risk management requirements have two things in common—massive data and intensive calculation. Hadoop can handle both, given its inexpensive commodity hardware and parallel execution of jobs.
Customer behavior prediction
Once the customer data has been consolidated from a variety of sources on a Hadoop platform, it is possible to analyze data and:
Predict mortgage defaults
Predict spending for retail customers
Analyze patterns that lead to customers leaving and customer dissatisfaction
Sentiment analysis – unstructured
Sentiment analysis is one of the best use cases to test the power of unstructured data analysis using Hadoop. Here are a few use cases:
Analyze all e-mail text and call recordings from customers, which indicates whether they feel positive or negative about the products offered to them
Analyze Facebook and Twitter comments to make buy or sell recommendations—analyze the market sentiments on which sectors or organizations will be a better buy for stock investments
Analyze Facebook and Twitter comments to assess the feedback on new products
Data-driven decision making is changing how we work and live. From data science, machine learning, and advanced analytics to real-time dashboards, decision makers are demanding data to help make decisions. With so much variety, volume, and velocity, the old systems and processes are no longer able to support the data needs of the enterprise. To support these endeavors and address these challenges, a revolution is occurring in data management around how data is stored, processed, managed, and provided to the decision makers. Big data technology is enabling scalability and cost efficiency orders of magnitude greater than what’s possible with traditional data management infrastructure. The data lake is a daring new approach that harnesses the power of big data technology and marries it with agility of self-service. Most large enterprises today either have deployed or are in the process of deploying data lakes. . The term was invented and first described by James Dixon, CTO of Pentaho : “If you think of a datamart as a store of bottled water—cleansed and packaged and structured for easy consumption—the data lake is a large body of water in a more natural state. The contents of the data lake stream in from a source to fill the lake, and various users of the lake can come to examine, dive in, or take samples.”